Map will help manage what is emerging as one of the defining challenges of the 21st century, its creators say
LONDON (AlertNet) – A new online mapping tool for monitoring global water resources will improve water-risk management by showing patterns of water stress, flooding, drought and areas of water access, its creators say.
The Aqueduct Water Risk Atlas, developed by environmental think-tank World Resources Institute (WRI) and an alliance of businesses and governments, can be customised by users to reflect a range of data with a few clicks of a computer mouse.
It combines 12 water-risk indicators to create maps showing where water problems might exist.
“Water – or the lack of it – is emerging as one of the defining challenges of the 21st century and it’s not just environmentalists who are saying so any longer,” said Betsy Otto, director of the Aqueduct project.
“The business community and world leaders are beginning to wake up to the problem.”
Users can plot and zoom in on locations that are most important to them, including facilities, suppliers, potential markets and proposed power plants. They can compare the potential exposure to water stress and the risk to people and industry in the various locations.
Coloured areas on the map change, depending on which data parameters are selected, to show patterns relating to water-intense industry sectors, including oil and gas, agriculture and chemicals.
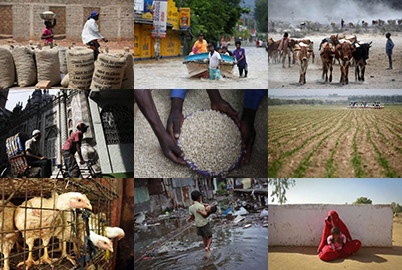
Global population is projected to rise to 9 billion by 2050, from 7 billion now, adding pressure on water resources, which must serve food and industrial production needs as well as provide drinking supplies and aid in sanitation management. Already, almost 1 billion people go hungry, 2.5 billion people lack proper sanitation and about 783 million people lack access to safe water.
The free mapping tool, which WRI has been developing in stages since 2010, doesn’t include sanitation data.
“We’re trying to look at a broader risk of water risk and water security. Sanitation and drinking water are some of the most important factors, but we also need to be thinking about water resources as a whole – all the various uses and needs for water and society,” Otto said.
Staged updates of the mapping tool in 2013 will provide data projections for 2020, 2030 and 2040.
Users will be able to measure seasonal variability, which can be important to help mitigate operational risk, she said.
“We’ll be looking at changes on the demand side … and also be looking at hydrologic projections due to climate change, so that will give a better picture of what might be the changes we’ll see in the future due to climate change," she added.
Our Standards: The Thomson Reuters Trust Principles.