Locals are tracking temperatures, humidity and other data to help officials protect those living in sweltering 'heat islands'
- Residents track 'heat islands' in their cities
- Hot weather kills more than 700 Americans on average each year
- Trees, reflective road coatings can help cities cool down
By Carey L. Biron
WASHINGTON, Sept 21 (Thomson Reuters Foundation) - Phyllis Robinson has noticed temperatures creeping up in her suburban neighborhood in Washington, D.C. in recent years, but when the forecast predicted a scorching day one Sunday last month she was excited rather than worried.
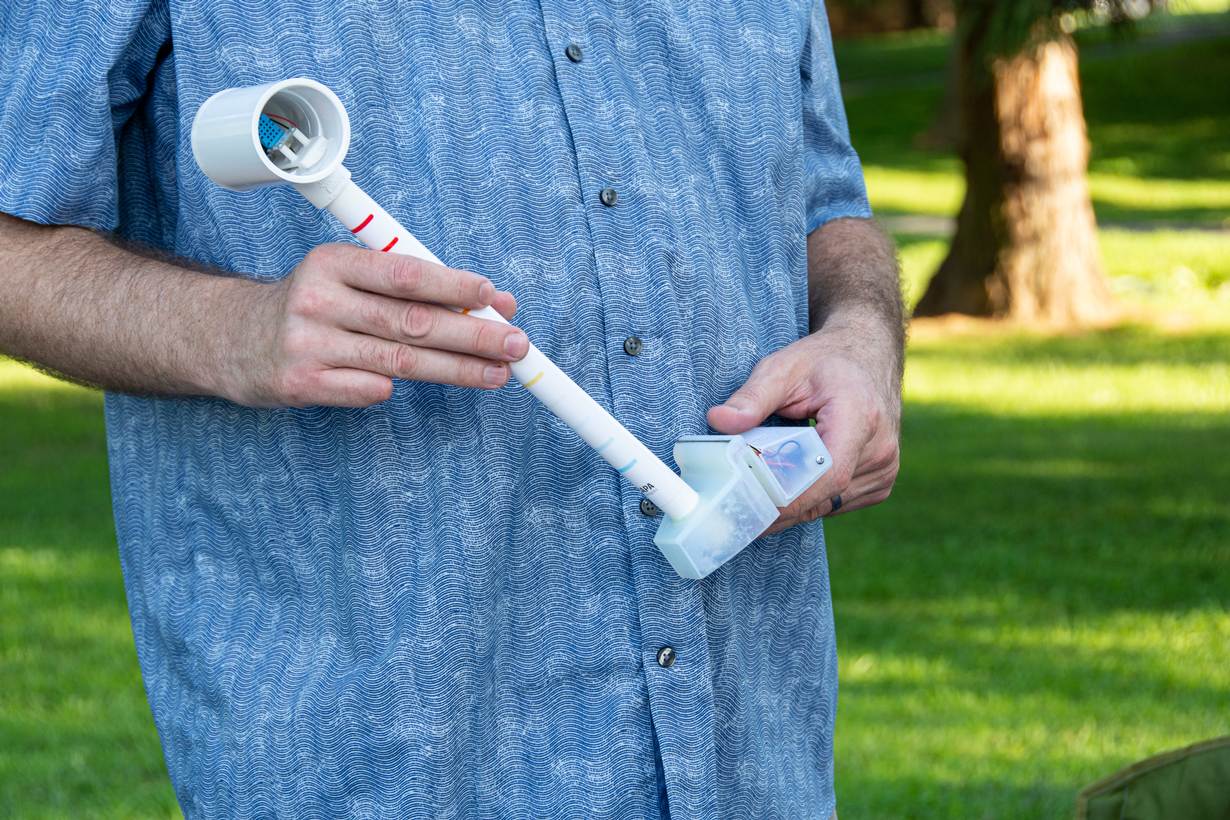
She and her husband strapped a small device to their car and slowly drove around their neighborhood and beyond, spending an hour traversing part of Montgomery County, where Robinson has lived for nearly 40 years.
"We thought, good, we'll get some high temperatures!" Robinson, 62, told the Thomson Reuters Foundation.
They and other residents took shifts throughout the day to record variations in heat, humidity and other indicators across 200 square miles (517 sq km) of the county, seeking insight into how climate change is raising temperatures in their area – and why some neighborhoods are feeling the heat more than others.
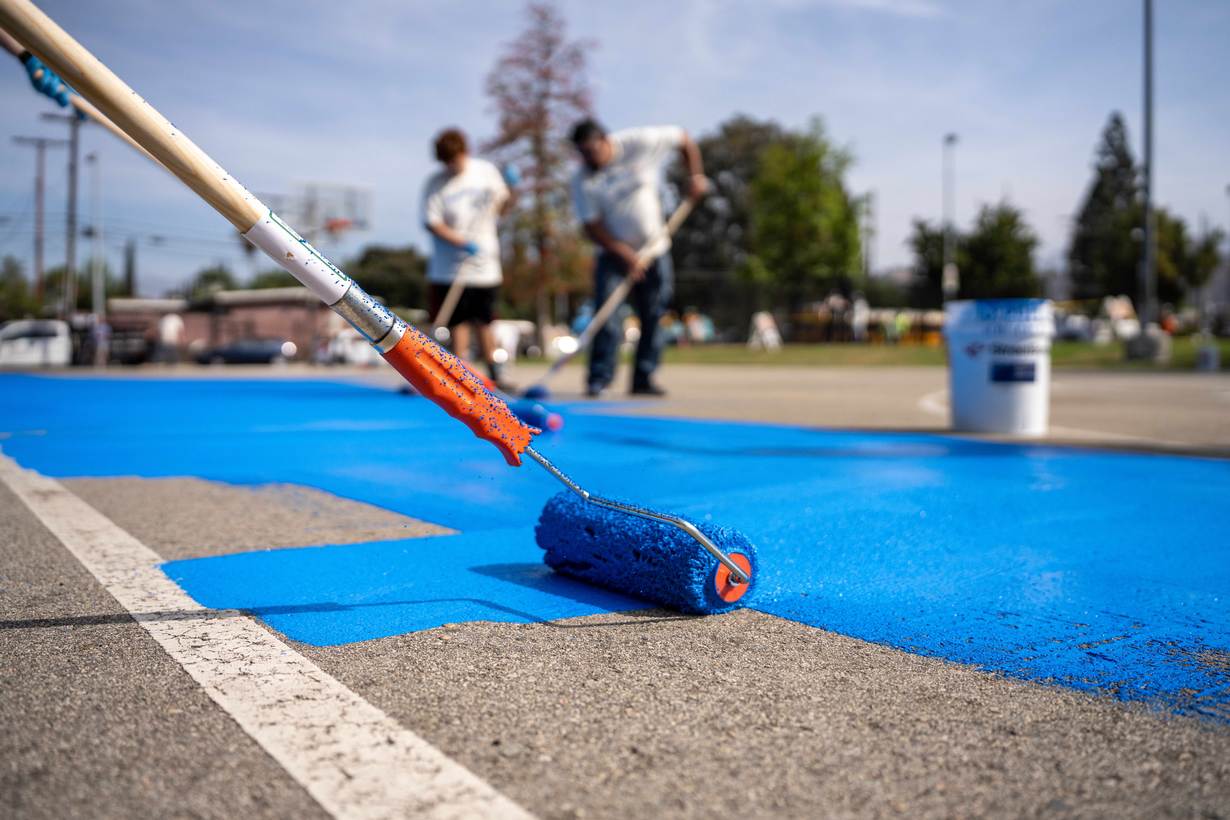
That could lay the groundwork for efforts to lower heat risk in the most vulnerable neighborhoods, through measures from tree planting to heat-reflecting paint for roads and roofs.
"We've been here in the sticky summers when the heat builds up in the day and doesn't get better at night. If you're surrounded by asphalt, that just exacerbates the problem," Robinson said.
But "there's a clear difference" if a pedestrian goes under some trees, she noted. "The idea that we could map that – I thought that was pretty clever," she said.
Robinson's drive around town was part of a federal program that this summer tracked "heat inequities" in 15 U.S. communities.
In the coming months it will do the same in Freetown, Sierra Leone's capital, and Rio de Janeiro, Brazil's second-largest city.
As scientists warn that summers will keep getting hotter, local heat mapping can help policymakers identify and tackle "urban heat islands".
These are often historically marginalized areas that can be several degrees hotter than nearby neighborhoods because of a lack of trees, shade and parks, and large amounts of heat-absorbing concrete.
When the results of the Montgomery County mapping project are available in a few months, officials can use the findings to figure out how best to cool down and educate the neighborhoods that need it most, said Laura Sivels, a program manager in the county's environmental protection division.
"We'll be able to see really fine-scale in terms of urban design, tree planting and education (needs), and what areas we need to be focusing on," she said.
VISUALIZE THE IMPACT
Heat kills more people than any other weather extreme in the United States, resulting in more than 700 deaths and nearly 68,000 emergency room visits on average annually, according to the Centers for Disease Control and Prevention.
In July, President Joe Biden announced new efforts to address rising heat, including making air conditioning eligible for federal energy assistance funds.
The government also unveiled a new online clearinghouse at Heat.gov to provide updates on extreme heat and steps residents and policymakers can take to protect themselves.
The heat island mapping project is run by the National Oceanic and Atmospheric Administration (NOAA), but it grew out of a local 2017 effort in Richmond, Virginia.
In cars and on bikes, residents gathered data that showed temperature differences of up to 16 degrees Fahrenheit (8.8C) across Richmond, giving insights that are now guiding a city planning update, a greenhouse gas-reduction plan and a stormwater management initiative.
Jeremy S. Hoffman, a scientist with the Science Museum of Virginia and part of the 2017 effort, said the impacts of the findings were "so socially relevant and civically legitimate" that other cities asked to run similar campaigns.
Since then, NOAA has overseen citizen-led mapping projects in 70 communities, leading to a flurry of new actions in response, said Morgan Zabow, a communications and outreach coordinator with the agency.
Data from heat mapping last year in the cities of Durham and Raleigh in North Carolina helped officials pinpoint where tree planting and reflective road coatings – both aimed at cooling local environments – would have the greatest impact, said Nicole Goddard, a sustainability analyst for Raleigh.
When NOAA mapped parts of New York City, researchers found the hottest places corresponded with areas that had historically been "redlined".
The term refers to racist bank policies starting in the 1930s that deemed it too risky to give housing loans to people living in mainly Black or minority areas, leading to lower rates of home ownership and lower home values.
"It's no coincidence that formerly redlined areas are also hotter, that areas with more people of color are hotter," said Liv Yoon, a social scientist previously with the Earth Institute at Columbia University, where she was principal investigator on the project.
Advocacy groups told the researchers they had been asking policymakers to plant more trees along the streets and create more green space, but had been turned away for lack of data, Yoon said.
"And now they have that data," she added. "That's why mapping is helpful – to visualize the impact."
HISTORY AND HEAT WAVES
Redlining has also left a stifling legacy in Pacoima, an industrial majority Latino neighborhood in Los Angeles.
"We are one of the hottest zones in Los Angeles, largely due to the planning of our city and the history of how it's been redlined," said Melanie Torres, a community organizer with Pacoima Beautiful, an environmental justice nonprofit.
And the heat has been getting worse, she said, especially at night.
Now Pacoima Beautiful is working with the city and GAF, one of the country's largest roofing manufacturers, on an experimental project to try to cool the entire neighborhood.
In July, volunteers applied a reflective coating to 10 square blocks of streets in the district, with plans to do future treatments for rooftops and more, said Jeff Terry, a GAF vice president.
Mapping is a key part of this project, too, with organizers driving an electric cart fitted with sensors to measure temperature, humidity and other indicators through Pacoima six times a day, five days a month.
Initial data is not yet available, but Torres said residents have already noticed a difference with their own inbuilt sensors: their eyes and feet.
Pedestrians used to be able to feel and even see the heat radiating up from the sidewalk, but now the heat waves "aren't as visible", she said.
"People wearing flip-flops say they don't feel the heat on their soles any longer."
Related stories:
New city 'heat officers' take aim at climate change's 'silent killer'
U.S. wildfire and heat risks to get new spending under Biden plan
'Life or death': Baking U.S. cities legislate for air conditioning
(Reporting by Carey L. Biron; editing by Jumana Farouky and Laurie Goering. Please credit the Thomson Reuters Foundation, the charitable arm of Thomson Reuters, that covers the lives of people around the world who struggle to live freely or fairly. Visit http://news.trust.org/climate)
Our Standards: The Thomson Reuters Trust Principles.